The postseason brings many newcomers to the website, often brought by curiosity about our home plate umpire pitch performance figures. Welcome! We’re thrilled that you are here. This article introduces UEFL f/x and how it stacks up against Statcast,
Brooks Baseball graphics, Pitch f/x, K-Zone, etc.
 |
| Introducing UEFL f/x pitch tracking. |
UEFL f/x is a tool that, like nearly every other pitch tracker out there, uses MLBAM's publicly available pitch location data and converts raw numbers into a determination as to whether an umpire's location-based call is correct or not. What you see on TV, on Baseball Savant, etc....it's all based on the same raw data from MLB in use here as well.
What do We Look at? UEFL f/x considers only callable pitches—that is, only pitches resulting in a call of "ball" or "strike," based on location. Swinging strikes, batted balls, foul/foul tips, hit-by-pitches, and pitchouts are excluded from the analysis.
When & Where is the Pitch Tracked? Pitches are tracked upon arrival at the front edge of home plate.
Variables: Four primary variables are considered.
px is the horizontal coordinate of the baseball, as measured from the center of home plate.
pz is the vertical coordinate of the baseball, as measured from the ground.
sz_bot and
sz_top are the bottom and top of the batter's strike zone.
 |
Brooks thinks Altuve and Judge have identical
strike zones. UEFL f/x knows better. |
Where UEFL f/x is Different: Unlike other pitch trackers, which tend to consider everything to the left of a line as a "ball" and everything to the right of the line as a "strike," UEFL f/x recognizes that error exists within the tracking computer itself (as specified by the hardware's manufacturer itself...it's as if there was a water resistant electronic measurement device with a warning not for use at a depth greater than 10 meters and most divers still tried to use it at 15 meters deep while we stayed at 10...the readings at 15 aren't as reliable as at 10, but it still
technically functions) and accompanying human operator, and has instituted a procedure to address this.
Furthermore, while many trackers, such as Dylan Yep's UmpireAuditor, fail to acknowledge that baseballs possess physical properties, such as a diameter that is wider than just a singular data point, UEFL-f/x accounts for the radius of a baseball in its calculations.
Listen to our interview with Dylan in which he admits his method fails to account for the radius of a baseball, which in turn tends to exaggerate the distance he alleges umpires miss calls by, and his vow to change methodology after we brought this fundamental error to his attention. Yet several months after our interview, the methodology has yet to be corrected.
Related Post:
Podcast - Truth About Baseball's Electronic Strike Zone (6/5/19).
Kulpa and Miller Rules: Pursuant to UEFL Rules 6-2-b-1 and -2, the following boundaries are applied to px and pz relative to determining whether a pitch is to be considered "ball," "borderline," or "strike."
>
Kulpa Rule (
Rule 6-2-b-1) refers to the horizontal location (PFX value "px") and is as follows...
>> (Measures in feet, all else equal) |0| < STRIKE < |.748|
< BORDERLINE
< |.914| < BALL.
>
Miller Rule (
Rule 6-2-b-2) refers to the vertical location (PFX value "pz") and is as follows...
>> (all else equal) BALL < sz_bot + MOE
< STRIKE
< sz_top + MOE < BALL.
 |
| Decision Table for UEFL f/x. |
Determining Quality of Correctness: When it comes to adjudicating QOC for a given pitch, a formula that resembles the accompanying
UEFL f/x Parameters table is used. In sum, a pitch's
px and pz variables must
both be "strike" (e.g., the pitch must be located within the strike zone and not touching the borderline range) in order for a call of "ball" to be considered incorrect.
Conversely,
either the
px or pz must be "ball" (e.g., the pitch must be located outside of the strike zone and not touching the borderline range) in order for a call of "strike" to be considered incorrect.
Any other permutation of "ball"—"borderline"—"strike" amongst the px/pz variables will result in a ruling being deemed Correct.
Compare to: If you're looking for an analogy as to how UEFL f/x operates, look to Replay Review (the decision options, not the parts of Replay we've critiqued that need work). Correct
≈ Confirmed, Borderline
≈ Stands, Incorrect
≈ Overturned.
Related Post:
Tmac's Teachable Moments - Let's Fix Replay (1/19/17).
Philosophy Behind UEFL f/x QOC: Our mission here is to track and analyze close and controversial calls in sport, with great regard for the rules and spirit of the game. To that end, we make a determination as to Quality of Correctness on each and every pitch that produces an ejection, but also during the postseason on every callable pitch that is thrown.
 |
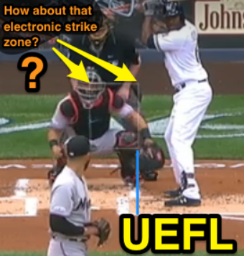
| The Fox Trax/box has a significant fail rate. |
PitchCast (which manifests on TV graphics as Fox Trax or ESPN K-Zone) has a statistically significant failure rate. Sometimes it fails to track pitches entirely, sometimes the ball track is incorrect, and sometimes the 'box' placement is inaccurate. The accompanying image indicates a situation in which FoxTrax's box graphic does not accurately represent the rules book strike zone.
Furthermore, Close Call Sports, and thus UEFL f/x, subscribes to the theory that an umpire’s call shall not be deemed incorrect unless evidence conclusively proves as much. Thus, a pitch ruled a “ball” with a horizontal px value in “ball” range and a vertical pz value in “borderline” range would be deemed “correct” on UEFL f/x for lack of conclusive evidence to indicate that the call was incorrect. The call would stand because we can't rely on the computer's accuracy to conclusively tell us otherwise.
 |
| Horizontal error is easier to measure. |
Horizontal Error (Kulpa Rule): From the days of Pitch f/x, we know that manufacturer SportVision publicly claimed its product was accurate to within approximately one-inch. That means that, conversely, Pitch f/x was not guaranteed accuracy under that margin. Hence, we at Close Call Sports crafted two separate margin-of-error rules, one for the horizontal and one for the vertical. This value may change in the future—maybe even during this very offseason's Rules Summit—but that's what we have for now, per SMT SportVision's statement.
We'll get back to the SportVision vs MLBAM issue in a minute.
Anywho, horizontal error is pretty straightforward, as home plate is a static entity. That's how
px values less than .748 feet are "always a strike," values greater than .914 feet are "always a ball," and everything in between is "borderline," subject to a vertical
pz value within the appropriate range.
 |
| Another example of a subtle box malfunction. |
Vertical Error (Miller Rule): Adjudicating
pz QOC is a little more complicated. In addition to the aforementioned margin-of-error,
pz relies on position relative to
sz_bot and
sz_top, as the strike zone changes for each individual batter and for each individual pitch.
What we’ve found is that baseball pitch operators will often use a player’s individualized
average strike zone to set the
sz_bot and
sz_top boundaries, which is not a foolproof method for any one individual pitch, but likely is highly accurate when averaged out over the course of an entire season. Sometimes, the operators will manually adjust the zone to account for a player’s unique movement during a specific pitch, but let’s just say that the method of establishing the computerized tops and bottoms of the strike zone is a bit lacking.
Regardless, we took a best-fit approach to this problem and called the process that produces this corresponding borderline range the Miller Rule.
Takeaway Red Flag: Baseball doesn't know how to accurately establish sz_bot and sz_top.
 |
| UEFL vs Brooks Baseball comparison. |
How This Stacks Up: UEFL f/x is unique in this approach—no other platform incorporates error, applies borderline ranges, and errs on the side of "the umpire isn't wrong unless there is ample clear and convincing evidence to prove it." Whether it's K-Zone,
Brooks,
Baseball Savant, etc., the ball vs strike determination takes the edge of home plate (e.g., about .831 ft for the horizontal |
px|) and creates a hardline bound. If |px| is less than or equal to .831, it's deemed a strike. If greater than .831, it's a ball. No exceptions, no leeway.
Brooks Baseball, to its credit, attempts to correct for calibration error in its under-the-hood numbers (but not its publicly-seen graphics), but margin-of-error is a whole other ballgame that seems to fall unaccounted for by most pitch trackers.
UEFL f/x Counterpoint: How is it fair to evaluate umpires based on computers that themselves may not have razor-sharp accuracy, could be off by a good-sized chunk of a baseball, and visualize strike zones using boxes that are 2D, not fitted for each pitch/batter, and often are calibrated incorrectly?
Example: Let’s go back to the National League Wild Card Game and HP Umpire Chris Guccione. Per UEFL f/x, using our methodology, Guccione graded out at 97.1% with a skew of +2 Chicago (a net of two more pitches favored Chicago than Colorado). Taking our involvement out of the equation and using only the raw Statcast figures, Guccione’s grade drops to 91% with a skew of +6 Chicago.
This difference helps explain one attribute as to why, as Brian Hertzog explained in Episode 3 of our Plate Meeting Podcast, players and teams see one thing while the umpire sees something entirely different.
Related:
Plate Mtg Podcast Ep 3 - Brian Hertzog (8/20/18).
Conflict Between Players and Umpires: You may recall several high-profile incidents between players such as Todd Frazier, Javier Baez, Ben Zobrist, and Carlos Gomez, over close pitches that didn’t go their way. Turning to the raw numbers of Statcast, some of these pitches appeared to have been missed.
On the other hand, the MLB Umpires Association, relative to the Carlos Gomez complaint,
publicly stated that umpire Andy Fletcher didn’t miss a single pitch during the Gomez at bat.
Related Post:
Fined - Carlos Gomez to Appeal Financial Penalty (9/25/18).
More recently, Dodgers rental Manny Machado voiced his complaint against NLDS Game 1 plate umpire Adrian Johnson over multiple strike calls. As MLBUA
tweeted, the pitches were in the zone.
 |
| Gomez and Fletcher use different technologies. |
This time, because it was a postseason game, we had UEFL f/x evaluate Machado's claims, and...Machado probably shouldn't have said much. Johnson's 96.3% performance actually favored Los Angeles by +4 pitches.
What we have here is a disconnect caused by multiple competing technologies and at least two different pitch calling languages. The players and teams are using one form of pitch tracking, with one set of boundaries and parameters, while the umpires are using something entirely different...and it's all based on the same raw data!
Teams and players subscribe to an absolute
Brooks-style zone (which itself is misleading because the graphic doesn't account for the radius of a baseball, three-dimensional zone, and seems to think every player has the same sz_bot 1.5 / sz_top 3.5 strike zone), while the umpires subscribe to a more UEFL-like zone (though the precise technology they use is a trade secret and more generous than UEFL fx).
 |
| UEFL f/x on a Brooks Baseball plot. |
No Plot Images: The accompanying "UEFL on Brooks" graphic depicts how this can be a problem.
Brooks uses an algorithm to convert
px and
pz values to newer numbers it deems to be better fits. Invariably, this results in data points being moved about.
Brooks also doesn't show the true size of a baseball (e.g., a ball has a nearly three-inch diameter), and assumes that everyone's strike zone runs from 1.5 to 3.5 feet. This also is misleading if not wholly inaccurate (see the Jose Altuve vs Aaron Judge graphic earlier in the article).
The UEFL on Brooks graphic indicates a pitch shown by Brooks to be a called ball well within the strike zone (data point Brooks #2). The original, un-manipulated (raw) location of pitch #2 (indicated by Orig. #2) is actually located further from the center of home plate and slightly lower. The UEFL f/x Kulpa Rule's borderline range has been superimposed in blue highlight; Orig. #2 clearly falls within this borderline range, while Brooks #2 does not.
In large part because the vertical strike zone bottoms and tops change every at-bat, if not every pitch, no visual pitch plot can be accurate if it shows more than one pitch (much less more than one batter) using the same sz_bot/sz_top boundaries. For this and other similar reasons regarding the simple "busy" look of the borderline range, UEFL f/x presently uses no graphics or plots in its analysis.
In the end, conventional pitch trackers would deem Pitch #2 an incorrect ball call, fans that look at the visual pitch plots would deem Pitch #2 an incorrect ball call, but UEFL f/x would deem it a correct call in the sense of our borderline "stands" framework.
History: Once upon a time, Major League Baseball decided to invest in computerized camera tracking of pitches. We wrote about this history on Close Call Sports and encourage you to read it, from QuesTec to Pitch f/x and Zone Evaluation, Statcast, Pitchcast, and Trackman.
Related Post:
Pitch f/x SMT Sportvision Sues MLBAM for StatCast 'Theft' (5/21/18).
 |
| SMT sued MLBAM over pitch tracking. |
In 2017, MLB replaced the existing Pitch f/x technology with the inhouse Statcast equivalent. Statcast’s manufacturer, SMT Sportvision, sued MLB Advanced Media over BAM’s PitchCast component, but the important note here is that there is a public-facing product—PitchCast, served by Trackman, or what used to be Pitch f/x—and a second proprietary version, Zone Evaluation, which is both what the umpires use AND which is also not available to the public.
In other words, the players' pitch tracking system is available to the public, while the umpires' pitch tracking system is not. Thus, what system, realistically, can we expect fans at large to use—the publicly available one, or the shrouded-in-secrecy system that no one outside of one opaque department of professional baseball has access to?
UEFL f/x attempts to portray what the umpires' system
might look like, but even so, UEFL f/x makes no account for poorly received pitches, catchers standing up to block out umpires, etc. UEFL f/x is solely concerned with pitch location numbers.
Referring back to the Guccione game, where UEFL f/x graded out at 97.1% while conventional trackers graded out at 91%. Take any one of those pitches that fall within that 91-97.1% differential and you’ll see that the umpire will consider the call correct, while the player—especially a Colorado player who sees a skew four pitches greater than what the umpire sees—will consider the call incorrect.
Compound this effect over the course of tens of thousands of pitches per year and the player-umpire disconnect becomes a little easier to understand.