Showing posts with label Sabermetrics. Show all posts

Friday, April 11, 2025

Mark Ripperger Calls a Perfect Game in KC

MLB Umpire Mark Ripperger called a perfect game in Kansas City, officiating Thursday's #Twins-#Royals game with 136 correct ball/strike calls out of 136 callable pitches thrown for a 100% accuracy plate score.

These numbers reflect postgame adjustment figures and are normalized to both UmpScorecards' and CCS' measurement standards.

This is not Ripperger's first brush with perfection. When Ripperger called A's pitcher Mike Fiers' no-hitter in 2019 for an overall accuracy score of 97.2%, his accuracy for Fiers' pitching was 100% (73/73).

Stats for HP Umpire Mark Ripperger on 4/10/2025
Balls: 89 called balls outside of strike zone / 0 called balls within strike zone = 89/89 = 100% Accuracy.
Strikes: 47 called strikes inside strike zone / 0 called strikes outside strike zone = 47/47 = 100% Accuracy.
Overall Game Score: 89/89 Balls + 47/47 Strikes = 136/136 = 100.0%. +0 Neutral.

Video as follows:

Thursday, February 13, 2025

MLB's Top Hothead Players (Most Ejections) - 2025 Edition

Who is MLB's most ejected player? As we prepare for baseball's 2025 season, we rank the major league's most ejected active players. Bryce Harper took the Hothead crown in 2019, so how does he stack up six years later heading into Spring 2025?

As we did in 2019, we'll use the umpire ejection sabermetric value Games Per Ejection (GPE) to chart the most frequently ejected players in active MLB gameplay. Using our historic benchmark of David Ortiz's 175 GPE (aka "the Papi line"), we crown MLB's leading active hothead position player.

At the time of our June 2015 study, Big Papi's one ejection per 197 games played led all players with at least 2,000 games played, a number of minimum games that limited our study's scope to veteran ballplayers.
Related Post: Determining The League's Biggest Hothead (It's Big Papi) (6/11/15).

By 2016, Bryce Harper had taken the #1 spot and in 2019, we found Harper had kept his top spot.
Related Post: Top 10 MLB Hothead Players by Ejection Frequency (2/28/19).

Harper is still MLB's #1 Hothead.
A few ground rules. We're looking at active position players (no pitchers) with a minimum of 500 games played and at least five career MLB ejections, for the sake of sample size. In the following table listing baseball's biggest hotheads, you can also click each player's name that appears in the accompanying table for their UEFL ejection report history.

Definition/Legend
GPE: Ejection Rate is measured in Games-Per-Ejection (GPE), with only those GPEs below 200 games per ejection reported. Only five eligible players have been ejected more frequently than the Papi line of 175 GPE.

Active MLB Position Players with Highest Ejection Frequency - MLB's Biggest Hotheads
#Player NameGames Per Ejection
(GPE [GP/EJ])
Raw # of Career Ejections
1Bryce Harper78.721
2Tim Anderson106.79
3Jesse Winker107.97
4Willson Contreras117.98
5Manny Machado157.711
6Matt Carpenter1898
Newcomer to Watch For: Jazz Chisholm's four ejections over 449 games gives him a GPE of 112.3.
*Matt Kemp was #2 after Harper until his retirement (87.5 GPE with 20 career ejections)

To summarize:
> Bryce Harper remains the league's biggest hothead player and is tied with Gary Sheffield for #2 all-time 78 GPE. MLB's #1 hothead remains Milton Bradley with a 55 GPE.
> Jazz Chisholm's GPE is 112.3, but his four ejections over 449 games does not qualify for this list.
> Mike Trout retains his crown as Cool & Collected. Trout and most other MLB'ers have never been ejected in their playing careers.

Video as follows:

Friday, March 3, 2023

A Look at Crew Chief Replay Review Statistics

Here at Closecallsports, replay guru TMAC has watched every single replay, charting each one since the inception of expanded video review. Besides needing a hobby, over the next few weeks TMAC will share that data with you in three parts. The first analysis was of all the MiLB Call-up umpires.  For that data look here: https://www.closecallsports.com/2023/01/2023-mlb-call-up-umpire-hiring-outlook.html

We now turn our attention to MLB crew chiefs. SPOILER ALERT: There may be some newly promoted names in the following list! We will formally announce the new chiefs at a later date.

In 2022 there were 670 calls overturned (OT) by the replay system, or one in every 3.63 games.  Remember there are four umpires assigned to regular season affairs so that comes to one OT, every 14.5 games as the average for each umpire.  If 14.5 is the barometer, you will notice some better and some not quite up to the MLB average.

Sunday, October 30, 2022

Pat Hoberg Calls Perfect Game in World Series Gm 2

Home Plate Umpire Pat Hoberg called a perfect game during Houston's victory over Philadelphia in Game 2 of the 2022 #WorldSeries between the Phillies and Astros. He saw 129 callable pitches—which includes balls and called strikes but excludes all swings—and officiated all of them correctly.

The reason Fox Sports' FoxTrax on-screen TV graphic zone may have differed from Hoberg's pitch calling is a tale as old as PitchCast, StatCast, Pitch f/x, and QuesTec, combined. Television visualizations still have trouble with vertical strike zones (computers have problems drawing these zones too), while PitchCast sacrifices accuracy for expediency, leading to errors in broadcast TV depictions.

The UEFL f/x look:
Balls: 89 called balls outside strike zone / 0 called balls within strike zone = 89/89 = 100% accuracy.
Strikes: 40 called strikes within strike zone / 0 called strikes outside strike zone = 40/40 = 100% accuracy.
Total Raw Accuracy Score: 129/129 = 100% accuracy (+0 Nu [Neutral Skew, favored neither team]).

Video as follows:

Thursday, August 25, 2022

CCS Stats Explanation - How to Read Pitch Strike Zone Data (px, pz)

If you've watched our MLB content, you'll notice certain variables and numbers appear on-screen during ball/strike ejections. In this illustrative video, we will teach you how to read pitch strike zone data—px, pz, RAD, MOE, etc.—to calculate umpire expected ball/strike calls. All numerical values presented are in feet.

In this video, you will learn about the following variables:
px - The pitch's horizontal location.
pz - The pitch's vertical location.
sz_bot - The batter's bottom-of-zone boundary.
sz_top - The batter's top-of-zone boundary.
RAD - The radius of a baseball subtracted from sz_bot or added to sz_top.
MOE - The margin of error variable applied to vertical pitch values (it is embedded within the core formula for horizontal location, since horizontal is a static entity whereas vertical changes depending on each batter's individual sz_bot and sz_top values).

For horizontal location, Umpire Expected Calls:
All else equal, |0| < STRIKE < |.748| < BORDERLINE-ABSOLUTE STRIKE < |0.831| < BORDERLINE-ABSOLUTE BALL < |.914| < BALL. This is known as the Kulpa Rule (UEFL Rule 6-2-b-1).

For vertical location, Umpire Expected Calls:
All else equal, BALL < sz_bot - RAD +/- MOE < STRIKE < sz_top + RAD +/- MOE < Ball. The borderline zone for vertical pitches is located in the span between sz_bot - RAD - MOE to sz_bot - RAD + MOE, and between sz_top + RAD - MOE to sz_top + RAD + MOE. This is known as the Miller Rule UEFL Rule 6-2-b-2).

Video as follows:

Thursday, March 25, 2021

2021 UEFL Draft Prospectus & Umpire Statistics

The Umpire Ejection Fantasy League presents its UEFL Draft Prospectus for 2021, which include ump statistics such as ejections and Replay Review information, dating back to the mid-2000s.

To register for and submit your Crew Chief, Primary, and Secondary Umpire draft picks, visit the 2021 UEFL Draft & Registration page. The 2021 draft closes March 31.

An additional related link is the UEFL Umpire Roster & Profiles page, which also includes game assignment history for the MiLB call-up umpires.

Historical Information and Draft Prospectus - 2021 UEFL Season
The following section provides statistics regarding top points-getter umpires and other leaders during past UEFL seasons. This information may also be found via the UEFL Portal's Historical Data page, which has been updated through the 2020 season. Umpires with names in strikeout are retired or otherwise ineligible for selection in the UEFL Draft.

General Information
Most Ejections Since 2005: 81 (Joe West), 70 (Marty Foster), 63 (Sam Holbrook).
Most Ejections Since 2014: 32 (Vic Carapazza, Will Little), 31 (Joe West), 28 (Dan Bellino), 25 (Bill Welke, Mark Ripperger), 23 (Mike Estabrook), 22 (Marty Foster, Sam Holbrook, Larry Vanover, John Tumpane, Carlos Torres).

2020 Umpire Leaderboard
"Perfect Crew" (Most Points): -cc Angel Hernandez (21 pts), P1/2 Ripperger (27 pts) & Bellino (22 pts), S1/2 Hernandez (18 pts) & Jim Reynolds (16 pts).
Ejections: Bellino (8); Ripperger (5); Carapazza, Little (4); Ted Barrett, Hernandez, Ron Kulpa (3).
Replay Points: Reynolds, Ripperger (6); Cory Blaser, Carapazza, Hernandez (5).
[Most Replays Experienced]: Ripperger (14); Eddings (13); Kulpa, Reynolds (12).
Review Accuracy-RAP: Blaser (1.000); Carapazza, Hernandez (.857).
Total Points: Ripperger (27); Bellino (22); Hernandez (21); Carapazza (18); Reynolds (17).
Crew Chief Points: Hernandez (21); T Barrett (12); Alfonso Marquez (11).
UEFL Awards: Best-Mark Carlson; Promising-Hoberg & Tumpane, Honorable-Hernandez & West.

2019 Umpire Leaderboard
"Perfect Crew" (Most Points): -cc Holbrook (26); P1/2 Estabrook (41) & Jeff Nelson (24); S1/2 Alan Porter (24) & Bill Miller (21).
Ejections: Estabrook (13); Larry Vanover (9); Jeremie Rehak, West (7); Marquez (6).
Replay Points: Laz Diaz, Mike Muchlinski (9); Kerwin Danley, Adam Hamari (8).
[Most Replays Experienced]: Rob Drake (26); Dan Iassogna (25); Dan Bellino, Ron Kulpa (24).
Review Accuracy-RAP: Diaz, Miller, Muchlinski (.800); Danley (.786); Greg Gibson (.769).
Total Points: Estabrook (41); Porter (28); Miller, Nelson, Vanover (24); Torres (22).
Crew Chief Points: Holbrook (26); Vanover (23); Gary Cederstrom, Tom Hallion (21);
UEFL Awards: Best-Jim Wolf; Promising-Hoberg & Porter; Honorable-Cooper & Guccione.

2018 Umpire Leaderboard
"Perfect Crew" (Most Points): -cc Welke (19), P1/2 West (31) & Brian Gorman (25), S1/2 Tumpane (21) & T Barrett (21).
Ejections: Little (9); Fletcher, G Gibson, Gorman, Hamari, Wendelstedt (6); Cooper, West (5).
Replay Points: Fieldin Culbreth (9); Chad Fairchild, Gorman (8); Tumpane (7).
[Most Replays Experienced]: Gorman, Carapazza, Carlos Torres, Chris Guccione (24).
Review Accuracy-RAP: Fairchild (.722); Culbreth, Tim Timmons (.714); Tumpane (.684).
Total Points: West (31); Gorman, Tumpane (25), Tripp Gibson (23), T Barrett (21).
Crew Chief Points: Welke (19); Gorman (14); Jerry Meals (13).
UEFL Awards: Best-T Barrett, Promising-Hamari & Blaser, Honorable-T Barrett & Cuzzi.

The prospectus continues after the page break for years 2010-2017.

Thursday, November 12, 2020

2020 Final Standings & UEFL's Perfect Crew

UEFL Awards Season concludes with the 2020 Umpire Ejection Fantasy League's final standings and announcement of this year's perfect crew. The highest score in 2020 was 104 and the lowest score possible was -16, a points spread of 120 (compare to 2019's Perfect Score of 136 and lowest score of -23 [bear in mind that 2020 produced a COVID-shortened 60-game regular season vs 2019's standard 162-game schedule]).
Related Post: 2019 UEFL Final Standings and the Perfect Crew (11/12/19).

2020 Perfect Crew (Highest Score): 104 points.
Crew Chief (Crew Division): Angel Hernandez (21 pts).
Primary Umpires: Mark Ripperger (27 pts) & Dan Bellino (22 pts).
Secondary Umpires: Angel Hernandez (18 pts) & Jim Reynolds (16 pts).

Primary Umpire Points Leaders:
1) Mark Ripperger (27 pts)
2) Dan Bellino (22 pts)
3) Angel Hernandez (21 pts)
4) Vic Carapazza (18 pts)
5) Jim Reynolds (17 pts)
T-6) Ted Barrett, Jeremie Rehak, Quinn Wolcott (15 pts)
9) Bill Miller (14 pts)
10) Edwin Moscoso (13 pts)

2020 UEFL Imperfect Crew (Lowest Score): -16 points.
Crew Chief: Larry Vanover (-3 pts).
Primary Umpires: Mike Muchlinski (-3 pts) & Nate Tomlinson (-3 pts).
Secondary Umpires: Chad Fairchild (-4 pts) & Chad Whitson (-3 pts).

Final Standings for the 2020 UEFL Season.
Replay Review Ranking by Umpire [min. n=4] (RAP)
1) Cory Blaser (1.000, 5-for-5).
T-2) Angel Hernandez (.857, 6-for-7).
T-2) Vic Carapazza (.857, 6-for-7).
T-4) Ramon De Jesus (.833, 5-for-6).
T-4) Ben May (.833, 5-for-6).
T-4) Jansen Visconti (.833, 5-for-6).
7) Alan Porter (.800, 4-for-5).
T-8) Jim Reynolds (.750, 9-for-12).
T-8) Ryan Additon (.750, 6-for-8).
T-8) Lance Barrett (.750, 6-for-8).
T-8) Pat Hoberg (.750, 3-for-4).
T-8) Jeff Nelson (.750, 3-for-4).
T-8) Alex Tosi (.750, 3-for-4).
T-14) Mark Ripperger (.714, 10-for-14).
T-14) Chris Guccione (.714, 5-for-7).
16) Ted Barrett (.700, 7-for-10).
T-17) Brian Knight (.667, 6-for-9).
T-17) Roberto Ortiz (.667, 6-for-9).
T-17) Jeremie Rehak (.667, 6-for-9).
T-17) CB Bucknor (.667, 4-for-6).
T-17) Marvin Hudson (.667, 4-for-6).
T-22) Andy Fletcher (.636, 7-for-11).
T-22) Paul Nauert (.636, 7-for-11).
T-24) Chris Conroy (.625, 5-for-8).
T-24) Quinn Wolcott (.625, 5-for-8).
Full Results: UEFL's MLB Umpire Replay Review Statistics & Sabermetrics

Most Raw Overturns (Greatest # of Overturned Calls)
1) 8: Doug Eddings, Chad Fairchild.
2) 7: Ron Kulpa, Shane Livensparger.
3) 6: Mike Muchlinski.
4) 5: Jordan Baker, Adrian Johnson, DJ Reyburn, Chad Whitson.

2020 Ejection Leaders
1) Dan Bellino (8).
2) Mark Ripperger (5).
T-3) Vic Carapazza, Will Little (4).
T-5) Ted Barrett, Angel Hernandez, Ron Kulpa (3).

2020 UEFL Final Standings (Ties resolved per Rule 5-3)
1) ajbeisheim (65 pts).
2) cyclone14 (56 pts).
3) FVB6 (53 pts).
4) bschmidt24 (52 pts).
5) Dutch65 (49 pts).
6) MrMLBSmith (48 pts, 18 PRM-A [Carapazza]).
7) Cha Lee (48 pts, 15 PRM-A [Wolcott]).
8) braytonboggs (48 pts, 11 PRM-A [Timmons]).
9) elaresD (48 pts, 6 PRM-A [Hamari]).
10) Krusty The Clown (47 pts).
11) lshlarson (46 pts, 10 PRM-A [L Barrett] | 9 PRM-B [Hudson]).
12) andrew downs (46 pts, 10 PRM-A [Scheurwater] | 3 PRM-B [Torres]).
13) Williamsb59 (46 pts, 5 PRM-A [Bucknor]).
14) Cincyump08 (45 pts, 15 PRM-A [T Barrett]).
15) bbfan (45 pts, 14 PRM-A [Bi Miller]).
16) lsh9168 (44 pts).
17) TXWrangler (43 pts).
18) Young_Ump (42 pts, 15 PRM-A [T Barrett]).
19) ref44 (42 pts, 9 PRM-A [Tumpane]).
20) Umpirewillie100 (42 pts, 8 PRM-A [Nelson]).
21) Richard Gordon (42 pts, 4 PRM-A [Joe West]).
22) tre_n.47 (41 pts).
23) UmpAtty (39 pts, 10 PRM-A [Scheurwater]).
24) nyumpire (39 pts, 4 PRM-A [Baker] | 21 PRM-B [Hernandez]).
25) Alex Cheriel (39 pts, 4 PRM-A [Eddings] | 7 PRM-B [Marquez]).

Complete Final Standings, points, and results available via the UEFL Portal's 2020 Standings page.
Umpire Leaders available at UEFL's MLB Umpire Replay Review Statistics and Sabermetrics page.

The Rules Summit will begin tomorrow.

Friday, October 9, 2020

Umpire Plate Scores - Comparing Scoring Methods

When we introduced UEFL f/x 3.0, we spoke of the plate score tool's transparency, accuracy, timeliness, and thoroughness for ball/strike umpire analysis. One question we received asks why numbers by another ump scorecard source doesn't match ours.

To begin, there exist roughly two main methods for strike zone analysis: one is to let MLB's Baseball Savant make all determinations as to whether a given pitch is located within or outside of the strike zone and the other is to parse the data to calculate and assign a probable ball/strike status to each pitch.

Boston University/UmpScores
The BU version, made famous from Mark T. Williams' umpire study, employs the former method, which is most convenient and less processor-intensive for a tremendously large set of data points. As we found in 2019, this Baseball Savant scraping method relies on a variable roughly known as "zone," which does exactly what it looks like: It assigns a single-digit number (1-9) for a pitch located within the strike zone and a double-digit number (11-14) for a pitch located outside the zone. Much like a MIDI file sans percussion from the 1990s, track 10 isn't used.

Because the Zone variable is derived from other variables to calculate what number to assign as a zone statistic, this approach essentially doesn't work with measured data and instead relies on a processed number pursuant to Savant terms and manipulation. Not great for the scientific method, but a lot easier and simpler to calculate whether an umpire's call of ball/strike matches with Savant's zone designation of 11-14 (ball) or 1-9 (strike). Thus, a ball call on a pitch with zone 14 would be deemed Correct and a ball call on a pitch with zone 9 would be Incorrect. Simple.

UmpScorecards
UEFL f/x and UmpireScorecards appear to share the second of data collection methods through analysis of raw variables px, pz, sz_bot, and sz_top.

The difference between UEFL f/x's tri-score report and Scorecards or Auditor's single, simplified report is primarily how calculations are made after collecting raw data.

Whereas UEFL f/x runs through a process to analyze each pitch three different ways for the three different scores, accounting for a certain measure of error and physical properties of a baseball (e.g., as we've stated since the beginning, Auditor artificially inflates umpire "missed call" statistics by failing to acknowledge that a baseball has a radius), the other systems only return a number for what we call ML Public, or a zero-error system.

Scorecards, meanwhile, took to creating graphics to represent what it calls "Worst Missed Calls in terms of change in run expectancy" (yes, there really is a significant font size difference, and that's part of the issue: it's designed as a tool to measure changes in run expectancy first and considers umpire accuracy determination somewhat of an afterthought). This proved problematic when, for Angel Hernandez's October 7, 2020 game, Scorecards claimed the worst missed call of the game (see above), labeled Pitch 1, was a ball call that...well...looks like a correct call, drawing several critical replies, such as "1 is a ball all day long. But we are counting that as 'inaccurate'?"

This is what a zero-error (ML Public) system does: creates zero allowance on the edges. Yet perhaps, thanks to these graphics, it might be easier to comprehend why exactly ML Public scores tend to trend lower than UEFL f/x (other than the margin of error issue): because computers, despite acting entirely logically, seemingly act decidedly inhuman in robotically applying criteria.

The other issue pertains to Scorecards admitting to not knowing where to draw the line as to the edge of the strike zone, and admitting to not knowing how Savant graphs its strike zones (e.g., how a full game's plot isn't normalized, dating back to the Brooks Baseball days of strike zone graphics). This, too, might just be problematic for large-scale analysis using very precise numbers where baseball is colloquially a game of inches, though in the 21st century, it has become a game of mere fractions.

This also explains the difference between Scorecards' numbers and our ML Public numbers: the values used for plate edges as well as the values used for the radius of a baseball might be different, which would explain different plate scores using conceivably similar zero-error methods. ML Public, for instance, just happens to calculate radius from circumference pursuant to Official Baseball Rule 3.01 (Auditor's favorite rule to ignore), and plate width from a combination of OBR 2.02 and Definition of Terms [Strike Zone].

Apparently, the pressure might be getting to Scorecards as evidenced by Friday morning's tweet, "I KNOW BALLS 1 AND 2 ARE VERY CLOSE. Please do not yell at me."

Must not be an umpire.

Video as follows:

Tuesday, September 29, 2020

About UEFL f/x 3.0 Plate Scores for Postseason

CloseCallSports.com
 will once again provide plate scores for every HP umpire during MLB's postseason through our UEFL f/x tool, upgraded and improved for 2020 by balancing transparency, accuracy, timeliness, and thoroughness to produce the fairest accounting for ball/strike performance following each playoff game.

In 2018, we introduced UEFL f/x 1.0, a pitch tracking device that, unlike Baseball Savant StatCast, Brooks Baseball, K-Zone, and nearly every purported umpire tracker in the field, accounts for a margin of error MLB quietly admits exists and which many baseball analysts have measured.

A full primer on UEFL f/x exists here, but in summary, UEFL f/x considers only callable pitches (ball/called strike), as measured upon arrival at the front edge of home plate, with the incorporation of a one-inch margin-of-error, pursuant to MLB's prior admission as to the technology's error. Pitches receive Quality of Correctness (QOC) designations based on boundary criteria, including Miller/Kulpa Rules (see UEFL Rule 6-2-b-1), and are assigned a status as Correct (QOCY) or Incorrect (QOCN).

Furthermore, while most trackers, such as Boston University's famous umpire study, lazily rely on MLB/Baseball Savant StatCast's determination of whether a pitch is located inside or outside of the strike zone (with a margin-of-error of zero), and while some even deliberately deceive by failing to acknowledge that a baseball is more than just a minuscule dot (pursuant to Official Baseball Rule 3.01, its circumference is between nine and 9.25 inches), or that by rule any portion of the ball passing through any portion of the strike zone results in a strike (see Definition of Terms: Strike), UEFL f/x goes straight to the source—the raw data including horizontal location aka px, vertical location aka pz, and bottom/top of the batter's strike zone aka sz_bot and sz_top, respectively.

In 2019, we added two additional scores to postgame reports for the sake of transparency and fairness: ML Private (aka Zone Evaluation Equivalent Estimate) and ML Public (aka zero-error), to accompany the existing UEFL f/x figure.

For example, Mike Estabrook's plate on September 26, 2020 (Milwakee/St Louis) is pictured as a product of UEFL f/x 3.0, featuring three scores: ML Private's 98.3%, UEFL f/x's 97.5%, and ML Public's 95.0%.

When we discussed the player-umpire disconnect on balls/strikes and, namely, how MLB's public-facing technology (ML Public) portrayed umpires as, on average, 91% accurate behind home plate while MLB, behind the scenes (ML Private) told umpires they were actually 97% accurate, this is precisely what the three-score report was meant to address.

Accordingly, a wholly average triple-score would read as ML Public: 91%, UEFL f/x: 94%, ML Private: 97%.

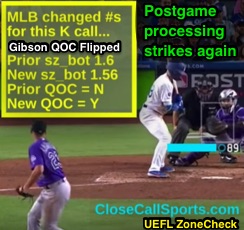
For 2020, we've taken it a step further. Over the past year, we've observed a huge flaw with real-time strike zone graphics called post-game processing. Succinctly, during a game, in real-time, MLB through its PitchCast application (branded by ESPN as K-Zone, by FOX as FoxTrax, etc.) feeds broadcasters as well as its own Gameday application (MLB dot com) px, pz, sz_bot, and sz_top variables based on placeholder strike zones for batters.

In other words, one incredibly significant reason MLB cannot afford to try real-game RoboUmp experiments at present is because RoboUmp simply cannot accurately adjust to individual batter heights and stances, and thus, zone heights sz_bot and sz_top...thus MLB feeds placeholder values which may or may not be accurate.

This is why during a game it may look like an umpire has missed a call while hours after a game, if one were to follow up, it would appear that the umpire made the correct call: this usually has the effect of improving the umpire's plate score.

We've observed this effect during ejections: The player or coach sees what appears to be an incorrect call upon watching a replay in the dugout-adjacent video room, ventures out to argue the call, and gets ejected. Broadcast shows the replay purporting to indicate an incorrect ball/strike call, and fans are left believing the umpire has erred. Hours later—after all attention regarding the pitch has shifted and the placeholder real-time strike zone box accepted as the real deal—MLB quietly goes back to the game data and changes sz_bot and sz_top. 

In this linked 2019 example, Dave Roberts argues a strike call by Greg Gibson at the batter's hollow-of-the-knee, only the computerized box, in real-time, indicated the pitch was located beneath the strike zone. Gibson ejects Roberts, replays ad nauseam convince Los Angeles the call was wrong. Hours after the game, MLB changes sz_bot to a value that has the consequence of changing Gibson's UEFL f/x Quality of Correctness from Incorrect to Correct. Similar stories exist for ejections by Ron Kulpa (Houston), Ramon De Jesus (Minnesota) and Jeremie Rehak (Anaheim).

For this reason, in 2020, we will report two sets of three-scores ML Private, UEFL f/x, and ML Public. On the night of every game, we will report preliminary/unprocessed scores and on the day after, we will report final scores. This should effectively illustrate pre-processing error, real-time computer vertical blind spot error, inflexible robot error, Altuve is shorter than Judge error, or whatever other label you wish to assign.

The compulsion, naturally, is to run with the first numbers that exist—the preliminary/unprocessed scores proven to routinely and consistently undervalue umpire accuracy figures—yet these are the same figures that the baseball world presents as static fact, and final. Our goal, is through follow-up reporting of final scores, is to illustrate baseball's unspoken zone problem relative to vertical ball/strike calls, and how this known piece of persistent real-time inaccuracy influences and impacts perceptions of umpire plate performance.

Tuesday, September 1, 2020

Crew Foster Sets Replay Record with Six Upheld Calls

MLB's 2020 season provided its latest trick as Chief Marty Foster's Crew set a new baseball record with six Replay Review calls during Monday's Orioles-Blue Jays game as Foster and umpires Alan Porter, Sean Barber and Jeremy Riggs had all six calls upheld via video review.

Because the Buffalo stadium doesn't have a dedicated major league replay video room, both teams during games at Sahlen Field are afforded two managers challenges. Here's the play-by-play.

Replay Review 1, Bot 4 (TOR Challenge): Out/Safe (Tag) at second base on Orioles pitcher Keegan Akin's pickoff of Blue Jays baserunner R2 Teoscar Hernandez, initially ruled "out" by 2B Umpire Marty Foster. After review, the call was upheld.

Replay Review 2, Bot 6 (BAL Challenge): Out/Safe (Tag) at third base on Orioles catcher Pedro Severino's attempt to throw out Blue Jays baserunner R2 Lourdes Gurriel, Jr on his attempted steal of third base, initially ruled "safe" by 3B Umpire Sean Barber. After review, the call was upheld.

Replay Review 3, Bot 9 (TOR Challenge): Out/Safe (Tag) at second base on Orioles catcher Severino's attempt to throw out Blue Jays baserunner R1 Derek Fisher on his attempted steal of second base, initially ruled "out" by 2B Umpire Marty Foster. After review, the call was upheld.

Replay Review 4, Top 10 (BAL Challenge): Out/Safe ("Force") at first base on Blue Jays pitcher AJ Cole's attempt to throw out Orioles batter-runner Hanser Alberto, initially ruled "out" by 1B Umpire Alan Porter. After review, the call was upheld.

Replay Review 5, Top 10 (Crew Chief Review): Out/Safe (Tag) at home plate on Blue Jays right fielder Hernandez's attempt to throw out Orioles baserunner R3 Mason Williams on his attempted score, initially ruled "out" by HP Umpire Jeremy Riggs. After review the call was upheld.

Replay Review 6, Bot 11 (Crew Chief Review): Out/Safe (Tag) at home plate on Orioles right fielder Anthony Santander/shortstop Jose Iglesias' attempt to throw out Blue Jays baserunner R1 Gurriel on his attempted score, initially ruled "out" by HP Umpire Jeremy Riggs. After review, the call was upheld.

In 2017, the World Baseball Classic broke a then-record for most Replay Reviews in a nine-inning game (five).
Related Post: WBC Game 2 Breaks Replay Review Record (3/22/17).

Video as follows:

Tuesday, November 12, 2019

2019 UEFL Final Standings and the Perfect Crew

Awards Season concludes with the 2019 Umpire Ejection Fantasy League's final standings and perfect crew. This year's perfect score was 136 and the lowest score possible was -23, a points spread of 159 (compare to 2018's Perfect Score of 117 and lowest score of -39).
Related Post: 2018 UEFL Final Standings and the Perfect Crew (11/12/18).

2019 UEFL Perfect Crew (Highest Score): 136 points.
Crew Chief: Sam Holbrook (26 pts).
Primary Umpires: Mike Estabrook (41 pts) & Jeff Nelson (24 pts).
Secondary Umpires: Alan Porter (24 pts) & Bill Miller (21 pts).

PRM Points Leaders:
1) Mike Estabrook (41).
2) Alan Porter (28).
3) Bill Miller, Jeff Nelson, Larry Vanover (24).
6) Carlos Torres (22).
7) Kerwin Danley, Sam Holbrook, Mike Muchlinski (20).
10) Gary Cederstrom, Doug Eddings (19).

2019 UEFL Imperfect Crew (Lowest Score): -23 points.
Crew Chief: Joe West (-5 pts).
Primary Umpires: Ryan Additon (-8 pts) & Gerry Davis (-2 pts).
Secondary Umpires: Gabe Morales (-4 pts) & Dan Iassogna (-4 pts).

Final Standings for the 2019 UEFL Season.
Replay Review Ranking by Umpire (RAP)
T-1) Laz Diaz (.800, 12-for-15).
T-1) Mike Muchlinski (.800, 12-for-15).
3) Bill Miller (.800, 8-for-10).
4) Kerwin Danley (.786, 11-for-14).
5) Greg Gibson (.769, 10-for-13).
6) Manny Gonzalez (.750, 6-for-8).
T-7) Gary Cederstrom (.714, 10-for-14).
T-7) Quinn Wolcott (.714, 10-for-14).
9) Roberto Ortiz (.706, 12-for-17).
T-10) Jeff Nelson (.700, 7-for-10).
T-10) DJ Reyburn (.700, 7-for-10).
12) Marvin Hudson (.692, 9-for-13).
13) Sam Holbrook (.688, 11-for-16).
14) Adam Hamari (.682, 15-for-22).
15) Chad Fairchild (.643, 9-for-14).
T-16) Chris Segal (.636, 14-for-22).
T-16) Hunter Wendelstedt (.636, 14-for-22).
T-18) Lance Barksdale (.636, 7-for-11).
T-18) Alan Porter (.636, 7-for-11).
T-18) John Tumpane (.636, 7-for-11).
T-18) Chad Whitson (.636, 7-for-11).
22) David Rackley (.632, 12-for-19).
T-23) Ted Barrett (.625, 10-for-16).
T-23) Tom Hallion (.625, 10-for-16).
T-25) Ben May (.625, 5-for-8).
T-25) Brennan Miller (.625, 5-for-8).
Full Results: UEFL's MLB Umpire Replay Review Statistics & Sabermetrics

Most Raw Overturns (Greatest # of Overturned Calls)
1) 14: Dan Iassogna.
2) 13: Ron Kulpa.
3) 12: Bill Welke.
4) 11: Dan Bellino, Vic Carapazza, Rob Drake, Alfonso Marquez.
8) 10: Ryan Blakney, Chris Conroy, Mike Everitt, Andy Fletcher, Ed Hickox, Stu Scheurwater, Jansen Visconti, Mark Wegner.

2019 Ejection Leaders
1) Mike Estabrook (13).
2) Larry Vanover (9).
3) Jeremie Rehak, Joe West (7).
5) Alfonso Marquez (6).

2019 UEFL Final Standings (Ties resolved per Rule 5-3)
1) RC2004 (87 pts).
2) trevortinyrichards (78 pts).
3) ralphus95 (68 pts).
4) Umppat (66 pts, 18 PRM-A [Gonzalez]).
5) JROD (66 pts, 14 PRM-A [West]).
6) Twnorton93 (66 pts, 11 PRM-A [Hamari]).
7) UmpBarrett (60 pts).
8) ADUB (59 pts).
9) Bob Abouy (58 pts).
10) ohmlb (57 pts).
11) Chewy6294 (56 pts, 13 PRM-A [Bellino], 41 PRM-B [Estabrook]).
12) BradleyEjAgain (56 pts, 13 PRM-A [Bellino], 14 PRM-B [West]).
13) ref44 (55 pts, 14 PRM-A [West], 24 PRM-B [Nelson]).
14) cyclone14 (55 pts, 14 PRM-A [West], 3 PRM-B [Tumpane]).
15) Fearsome Four (54 pts, 24 PRM-A [Bi Miller]).

Complete Final Standings, points, and results available via the UEFL Portal's 2019 Standings page.
Umpire Leaders available at UEFL's MLB Umpire Replay Review Statistics and Sabermetrics page.

The Rules Summit will begin tomorrow.

Friday, October 11, 2019

Postseason Pitch Skew - Dodgers Catcher Change

After the Dodgers lost the 2019 NLDS to the Nationals, a few people noticed that Los Angeles benefited from 12 more incorrectly called pitches than Washington, a stat called pitch skew. Do umpires love LA or is there a more logical and impartial explanation for why the team whose last World Series win occurred in 1988 seems to consistently lose in the postseason enjoy positive pitch skew differential over opponents?

To answer this question, we traced LA's postseason history since 2013—which was the first year of UEFL pitch skew statistics, defined as the net number of incorrectly ruled pitches that favor a given team over its opponent [e.g., the pitcher throws a pitch outside the strike zone and the home plate umpire calls it a strike...this results in a skew of +1 for the defensive team; conversely, a pitcher who throws a pitch within the strike zone called a ball earns a skew of +1 for the offensive team. Add up all skews throughout the game and you get a game skew; add all games together and you have a series skew]—and noticed something very interesting.

In 2013, the Dodgers suffered a negative 20 (-20) pitch skew against St. Louis in the NLCS (conversely, you could say that St. Louis enjoyed a +20 skew over LAD), while in 2014, the Dodgers went minus-15 against St. Louis in the NLDS. Both times, St. Louis won the series.

Framing can buy—or cost—strike calls.
In 2015, pitch skews were not statistically significant, but in 2016, something remarkable happened. In quite the turnaround, Los Angeles experienced a +15 skew (beat Washington in the 2016 NLDS), followed by +15 skew in the 2017 NLCS (beat Chicago), +10 skew in the 2018 World Series (lost to Boston), and +12 skew in the 2019 NLDS (lost to Washington).

Answer: Catcher Framing. Meet AJ Ellis, one of the worst statistical pitch framing catchers in all of baseball who just happened to be on the Dodgers from 2008 until 2016. AJ played in all six games of the 2013 NLCS and all four games of the 2014 NLDS against St. Louis. His opposing backstop for both series was Yadier Molina, one of MLB's best pitch framers at the time.

In short, Yadi "stole strikes" with his framing ability while Ellis occasionally stole balls with his bottom-10 frame attribute.

Los Angeles turned its skew luck around in 2016.
2015-16: LA Meets Analytics. The Dodgers front office then got smart and acquired a series of catchers—such as Austin Barnes and Yasmani Grandal—whose framing abilities were elite, pursuant to a metric known as Strike Zone Runs Saved or Catcher Framing (depending on where you look).

For example, in 2019, Dodgers catcher Russell Martin ranked #1 in Catcher Framing on the MLB leaderboard amongst catchers whose clubs made the postseason. Barnes ranked two spots behind Martin and rookie catcher Will Smith was two spots behind Barnes (Atlanta's Tyler Flowers was #2 and Milwaukee's Yasmani Grandal—a former Dodgers property!—was #4).

Conclusion: In other words, the Dodgers used to be very bad at the skew game thanks to substandard pitch framing. After getting bounced by St. Louis in 2014 and beaten by double-digits by then-supreme skewer Yadier Molina, LA's baseball team turned to the statistics and transacted to acquire catchers with superior—near-elite—pitch frame ability, which in turn caused LA to experience a dramatic reversal in its pitch skew fortunes.

Video as follows:

Monday, September 30, 2019

2019 Stats - Ejections Spike, But So Do Correct Calls

Ejections spiked drastically in 2019 as umpires concluded the regular season with the most heave-ho's since 2006, but not for a lack of umpire accuracy. Plate scores actually improved and Replay Reviews were down—and so were overturned calls. Read on for a glimpse into the MLB umpire stats for 2019.

Ejection Events, Especially for Balls/Strikes, Soared to Highest Level in 13 Years
Umpires ejected more players, coaches, and managers in 2019 than at any other time during the video instant replay era—and that includes both limited home run reviews (2008-2013) and expanded Replay Review (2014-present).

The 217 ejections during the 2019 regular season easily eclipsed the 2018 regular season's total of 179 ejections, and comprised the most disciplinary dismissals since the 2006 season's 218 ejections. 2019 now ranks seventh-highest since the leagues merged in 2000, trailing just 2000-01 and 2003-06.

Reason for Ejection (Balls/Strikes Soars): After 2014's institution of expanded replay, ball/strike ejections have increased or remained at comparable levels year-to-year that at all rates outpaced ball/strike ejections experienced during pre-2014 seasons.

In 2019, the climb continued with a whopping 133 ejections for arguing a ball or strike call, a 40% increase over 2018. Of these 133 ejections, the umpire's call was correct 96 times, incorrect 33 times, and could not be conclusively categorized as correct or incorrect on four occasions (i.e., the computer malfunctioned, generally failing to track the pitch entirely), corresponding to a Quality of Correctness—Correct percentage of 74%.

In 2018, umpires were 65% accurate on the 95 ball/strike calls that led to ejection, while in 2017, that figure was just 54% over 101 calls.

The method of ball/strike QOC evaluation remained constant in all three years, which means that 2019's dramatic ejections increase was associated with a greater frequency of correct calls that precipitated the ejection events.

Sunday, September 1, 2019

Umps Surpass 2018 Ejections Total in August 2019

With a pair of ejections Friday, MLB surpassed 2018's total for regular season ejections...and we still have an entire month left to play in 2019. Umpires are on pace for over 200 heave-ho's for the first time since 2015, when baseball's second season of Replay Review and the slide rule, too, helped cause the spike. What's the reason?

New Era: Not just a hat company, ejection trends in Major League Baseball tend to follow a pattern. Since 2000—the World Umpires Association (WUA)'s first year as the MLB umpires' official collective bargaining unit—ejections have spiked and crashed, coincidentally or otherwise coinciding with several key events in modern baseball history. The following analysis (watch the video if you'd like the fast version) reviews ejection numbers and statistics since the year 2000 and attempts to investigate why ejections have increased in 2019.

Friday, August 16, 2019

2019 Replay Stats & Leaders at Review 1,000

With Friday evening's first Replay Review—an upheld caught steal call at second by 2B Umpire Laz Diaz in Tampa Bay—comprising MLB's 1,000th use of Replay during the 2019 regular season, we present our statistics and sabermetrics of baseball's video technology thus far.

Totals to Date: 1,000 Replay Reviews.
> .536 Review Affirmation Percentage (RAP).
  > 536 Upheld & 464 Overturned.

Remaining "Perfect" Umpires (No Overturns):
Brian Gorman (2/2 = 1.000 RAP).
Scott Barry (1/1 = 1.000 RAP) [Injured].
Related Post: Injuries - Everitt, Hallion & Barry Hurt on Tuesday (6/4/19).

Top 20 Umpires in RAP (Upheld-for-Total Chances):
1. Gorman, 2. Barry = 1.000 RAP.
3. Greg Gibson & DJ Reyburn (both 6-for-7) = .857 RAP.
5. Bill Miller & Mike Muchlinski (8-for-10) = .800 RAP.
7. Manny Gonzalez & Tom Woodring (4-for-5) = .800 RAP.
9. Ted Barrett & Marvin Hudson (7-for-9) = .778 RAP.
11. Laz Diaz (10-for-13) = .769 RAP.
12. Kerwin Danley (9-for-12) = .750 RAP.
13. Tim Timmons (5-for-7) = .714 RAP.
14. Adrian Johnson (12-for-17) = .706 RAP.
15. Todd Tichenor, Larry Vanover & Quinn Wolcott (9-for-13) = .692 RAP.
18. Adam Hamari (14-for-21) = .667 RAP.
Brian Gorman has been perfect (in 2 tries).
19. Chris Segal (12-for-18) = .667 RAP.
20. Roberto Ortiz (8-for-12) = .667 RAP.

Most Overturned Calls, Raw Number:
1. Ron Kulpa = 12 Overturns / 20 Total (.400 RAP).
1. Dan Iassogna = 12 Overturns / 19 (.368 RAP).
3. Bill Welke = 11 Overturns / 18 (.389 RAP).
4. Andy Fletcher = 10 OTs / 19 (.474 RAP).
5. Vic Carapazza = 10 OTs / 14 (.286 RAP).

Most Successful Teams (Success Percentage):
1. Royals = 17 Overturns-for-23 Total = .639 TSP.
2. Yankees = 11-for-17 = .647 Team Success Pct.
3. Rangers = 27-for-42 = .643 TSP.

Reviews by Type (Uphold + Overturn = RAP):*
Out/Safe (Force-lite - 1st): 77 + 176 = .304 RAP.
Out/Safe (Tag - Into Base): 93 + 65 = .589 RAP.
Out/Safe (Tag - Stolen Base): 74 + 57 = .565 RAP.
Out/Safe (Pulled Foot): 39 + 35 = .527 RAP.
HBP/No HBP: 39 + 30 = .565 RAP.

*Above list includes Top 5 uses of Replay Review. For full list and other statistics, see our Umpire Replay Review Statistics and Sabermetrics page.

Tuesday, July 9, 2019

2019 MLB All-Star Discussion & Replay Sabermetrics

As 2019 All-Star Game Umpires, including Crew Chief/HP Umpire Mark Wegner, Brian O'Nora (1B), Phil Cuzzi (2B), Tim Timmons (3B), DJ Reyburn (LF), and Jordan Baker (RF) take the field in Cleveland with Replay Official Fieldin Culbreth at MLBAM headquarters in New York, we open the floor for 2019 All-Star Game discussion and an open forum on baseball officiating. Also included here is an overview on our statistics and sabermetrics for the ceremonial first half of the 2019 season.
Related: 2019 MLB All-Star Game Umpires.

Notes include home plate umpire performance according to Statcast/pitch f/x and UEFL Rules 6-2-b-1 (horizontal bound, "Kulpa Rule") and 6-2-b-2 (vertical strike zone, "Miller Rule"). Plays include significant events, if such plays occur.

- 7/09/19, AL@NL: HP Umpire Mark Wegner: pfx. 94/96 Balls + 36/37 Strikes = 130/133 = 97.7%. +1 NL.

Close or Notable Plays (Green = QOC Correct / Red = QOC Incorrect / Yellow = QOC Irrecusable).
- 1B Umpire Brian O'Nora's out call (Force - 1st) is overturned in the 2nd inning.

Replay Review Records (2019 Season, Opening Day through All-Star Break) - RAP:
Mark Wegner: 63rd, .400 RAP (4/10).
Brian O'Nora: 42nd, .500 RAP (6/12).
Phil Cuzzi: 49th, .467 RAP (7/15).
Tim Timmons: 12th, .750 RAP (3/4).
DJ Reyburn: 12th, .750 RAP (3/4).
Jordan Baker: 85th, .167 RAP (1/6).
Fieldin Culbreth: 38th, .556 RAP (5/9).

League-Wide Replay Review Stats
Total Upheld Rate: .525 RAP (388/739).
Perfect Umps: Gonzalez (3/3), Gorman (2/2), Miller (1/1), Barry (1/1).
Most Raw Overturns: Kulpa (10, .375 RAP), B Welke (9, .357), [4 Tied] (8).
Call Most Likely to be Upheld: Appeal Play (Missed Base) (3/3 Upheld, 1.000 RAP).
Call Most Likely to be Overturned: Out/Safe (Force - 1st) (130/184 Overturned, .293 RAP).
Most Successful Team in Review: TEX (25/35, .714 TSP), KC (11/16, .688), CWS (12/18, .667).
Least Successful Team in Review: PIT (9/30, .300 TSP), SF (4/13, .308), SEA (8/25, .320).
Total Reviews: 739 Replay Reviews through 1344 MLB games (on pace for 1336 reviews).
Total Ejections: 114 Ejections through 1344 MLB games (on pace for 206 ejections).
Most Ejections: Mike Estabrook (8); Joe West (6); Jeff Kellogg, Jeff Nelson (5); Jeremie Rehak (4).
Most UEFL Points, Primary Umps: Estabrook (25), Nelson (16), Cuzzi (12).
Most UEFL Points, UEFL'ers: ref44 (40), JROD (36), tlh210 (35), Chewy6294 (33).

Full Ejections Listing: CCS/Umpire Ejection Fantasy League's MLB Ejection List page.
Full Replay & UEFL Stats: Close Call Sports & UEFL's Replay Review Statistics page.

Overall Team Success Percentage, Managers in the All-Star Game (TSP):
AL Manager Alex Cora (BOS): TSP = .552 (16 overturned / 29 total), 8th in MLB, 6th in AL.
NL Manager Dave Roberts (LAD): TSP = .591 (13 overturned / 22 total), 5th in MLB, 1st in NL.

Monday, March 11, 2019

Top 15 MLB Hothead Managers by Ejection Frequency

We've published the Top 10 MLB Hothead Players by Ejection Frequency, so now it's time to list the Top 15 Hothead Managers in Major League Baseball. Once again, the umpire sabermetric value Games Per Ejection (GPE) will be used to determine the most frequently ejected skippers in the game.

As we used David Ortiz's 175 GPE for the players' benchmark, we will use all-time managerial ejections leader Bobby Cox's mark of 161 ejections over 4,501 regular season + 136 postseason games, or 29 GPE as our basis for illustration.

Perhaps, however, the more apropos comparison for Cox's notably incessant managerial GPE of 29 is Milton Bradley's GPE of one ejection for every 55 games played.
Related Post: Determining The League's Biggest Hothead (It's Big Papi) (6/11/15).

Rick Renteria is the most-frequent skip ejectee.
Here are the results for the ten most-frequently ejected active managers (minimum 300 games managed). Because managing a team is very different from playing on one, we'll only include data from a person's time as a bona fide manager of a major league ball club. You can also click each skipper's name that appears in the accompanying table for that individual's UEFL ejection report history.

Note that the language used—Hothead Manager—is meant as a consistent title in concert with our Hothead Players feature. Many times, however, a manager—such as Cox—would be ejected not because of a "hothead" reason, but in order to protect a player, who might instead be the true "hothead."

Legend and Definitions
Ejection Rate: Measured in Games-Per-Ejection (GPE).
GPE: Games played divided by their ejections.
EPS: Ejections per Season, based on 162 GP.

Active MLB Managers with Highest Ejection Frequency
#Player NameGames Per Ejection
(GPE [GP/EJ])
Ejections Per Season
(EPS [E/GP*162])
1Rick Renteria276.05
2Ron Gardenhire295.53
3Joe Maddon404.05
4Brad Ausmus404.02
5Clint Hurdle413.96
6Don Mattingly453.63
7Brian Snitker503.25
8Craig Counsell523.18
9Bruce Bochy523.10
10Andy Green543.00
11Ned Yost552.92
12Bob Melvin562.89
13AJ Hinch572.83
14Bud Black582.79
15Terry Francona692.35
15Scott Servais692.33

To summarize:
> Alex Cora (81 GPE and 1.00 EPS), Aaron Boone (54 GPE and 1.50 EPS), and Mike Shildt (35 GPE and 4.70 EPS) didn't make the table because they had too few games of managerial experience.
> Joe Torre (65 GPE and 2.49 EPS), Joe Girardi (48 GPE and 3.37 EPS), and John Gibbons (30 GPE and 5.32 EPS) didn't make the table because they are no longer active managers.